

Did you know that the average small to medium business spends over $10,000 on Google Ads every month? Larger companies spend even more! It’s not surprising, considering the immense reach and targeting power Google Ads provides.
Digital marketing has become the cornerstone of modern advertising. Spending $10,000 a month on Google Ads can be far more cost-effective than traditional methods like printed posters, which may only be seen by a few passersby, or flyers that often end up in the trash.
With its ability to target the right audience precisely, a well-executed digital marketing strategy can drive significant growth and measurable results for any business.
Running Google Ads campaigns can be tricky, but when done right, the results can be extraordinary.
Whether you’re a new business owner or someone looking to enhance your existing advertising efforts, understanding current Google Ads benchmarks is essential for crafting an effective strategy. It’s important to know what your expected CTR, CPC, and conversion rates should be. If your results aren’t aligning with industry averages, it’s time to optimize your keywords, ads, landing pages, and offers to boost performance.
Let’s dive into the most current data to help you improve your Google Ads campaigns.
Why Google Ads Industry Benchmarks Matter
Google Ads industry benchmarks provide essential, data-driven insights that help evaluate the effectiveness of your campaigns. These benchmarks serve as a clear reference point to measure how your campaigns compare to industry standards, highlighting both your successes and areas that need improvement.
Whether you’re running search or display campaigns, benchmarks allow you to quickly identify what’s working and where there’s room for growth. Metrics like average conversion rates, CPC, and click-through rates (CTR) are critical to optimizing performance. By keeping track of these metrics, you can stay competitive, make necessary adjustments, and ensure your campaigns align with industry standards.
Key Google Ads Metrics and Why They Matter
Understanding the key Google Ads metrics within the context of industry benchmarks allows you to set clear goals for your campaigns. This helps fine-tune your strategy and maximize results, ultimately improving your return on investment (ROI).
Let’s take a closer look at the most important metrics that reflect how your Google Ads campaigns are performing:
- Average Cost Per Conversion: This metric directly ties to running a cost-effective advertising strategy. It shows how much it costs to achieve a desired action, whether it’s a purchase, sign-up, or inquiry.
- Average Conversion Rate: This tells you how many of your clicks actually lead to valuable actions, such as purchases, form submissions, or phone calls. It’s a direct indicator of how effective your ad and landing page are at converting traffic into real business outcomes.
- Average CPC (Cost Per Click): The lower your CPC, the more clicks you can get for the same budget, which is always beneficial. Monitoring and reducing CPC means you’re getting more value from your ad spend.
- Average Click-through Rate (CTR): A high CTR means your ads are resonating with the right audience and driving engagement, while a low CTR suggests your ads may not be grabbing attention. This is a crucial metric to optimize to increase campaign performance.
Each of these Google Ads metrics provides actionable insights, helping you assess your campaigns with a meaningful, data-driven context. By comparing your performance to Google AdWords industry benchmarks, you can identify areas for improvement and stay ahead of the competition.
Average Click-Through Rate (CTR) for Google Ads
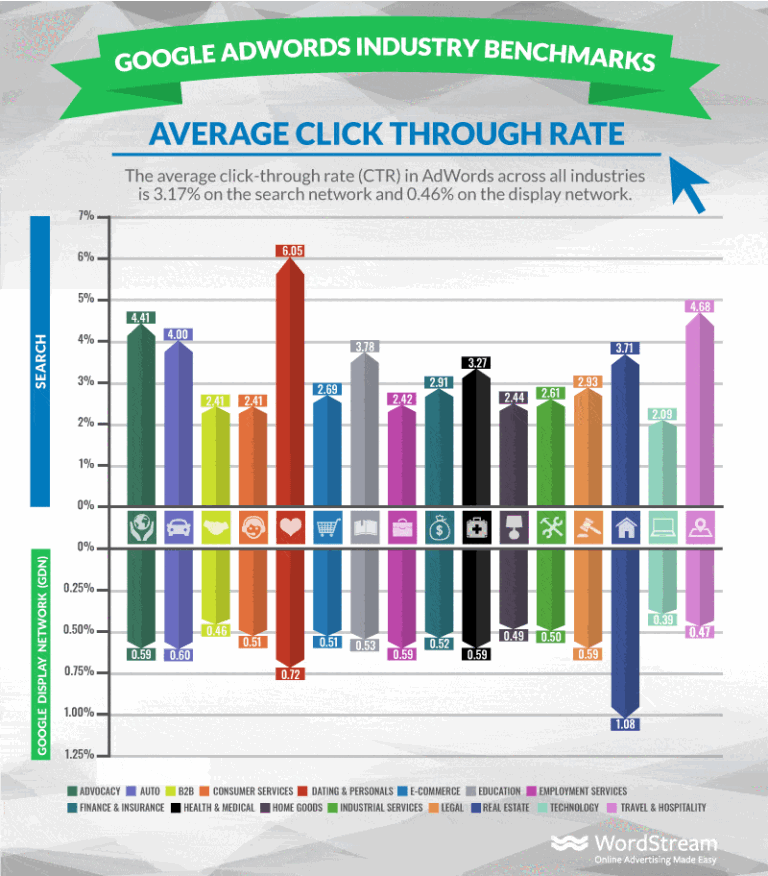
The average click-through rate (CTR) for Google Ads campaigns varies depending on the type of ad and industry. As of 2025:
- Search Ads: The average CTR for search ads across all industries is approximately 6.42%.
- Display Ads: The average CTR for display ads across all industries is 0.46%.
It’s important to note that CTR can fluctuate based on the industry. For example, industries like technology and customer services may see lower CTRs because they typically require more research from consumers before making a decision. However, industries like e-commerce or local services tend to see higher CTRs due to the more immediate intent of their audience.
While the average CTR for Google Ads search campaigns has increased over the past few years, Display Ads CTR remains relatively low. This indicates that it’s becoming more competitive, and advertisers need to fine-tune their targeting and messaging to stand out in a crowded market. To understand where your campaigns stand, comparing your results with CTR industry benchmarks can help you assess whether your performance is on track or needs optimization.
The Average Cost Per Click (CPC)
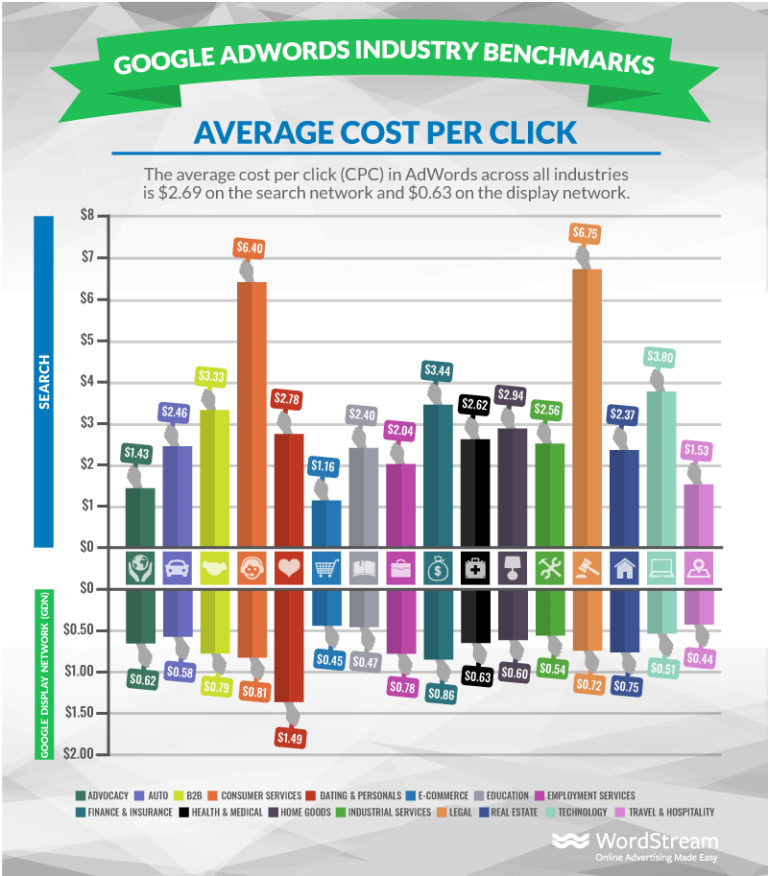
The average cost-per-click (CPC) in Google Ads varies significantly between the search network and the display network:
- The average CPC for the search network across all industries is $2.69.
- The average CPC for the display network is considerably lower, at $0.63.
These figures have increased over the past few years as more businesses turn to Google Ads for small businesses for their marketing campaigns, intensifying competition and driving up costs.
Among industries, the legal sector tends to have the highest CPCs. According to the Search Engine Journal, the keyword “lawyer” is the fourth most expensive keyword on Google Ads. This highlights how competitive and costly the legal industry is in paid search campaigns.
While CPCs for many industries are relatively affordable on the Google Display Network, certain sectors, like legal services, often face significantly higher costs due to the high demand for certain keywords. If your CPC is much higher than the average, it may be worth consulting with a paid search professional for expert advice on optimizing your campaigns and reducing costs.
Average Cost Per Action (CPA) in Google Ads by Industry
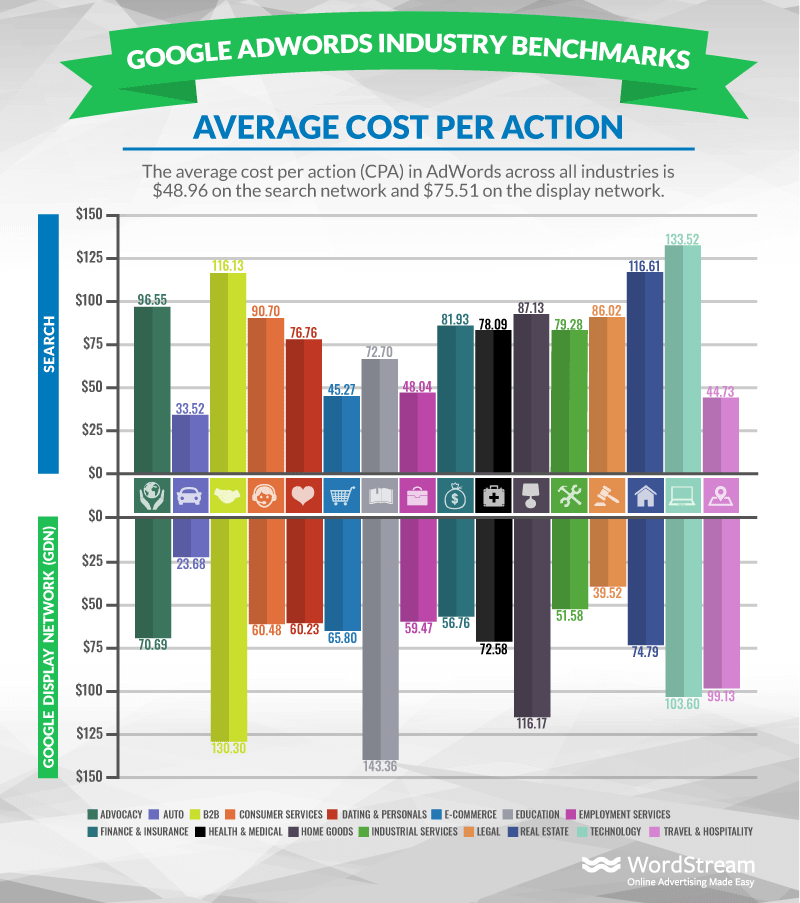
The Cost Per Action (CPA) metric has experienced notable changes over the past few years. On average, the lowest CPA across industries is in the automotive sector, with an impressive $33 per action. Meanwhile, industries like B2B Google Ads, real estate, and technology face higher CPAs, often exceeding $100 per action.
While we generally expect advertising costs to rise over time, it’s interesting to note that the average CPA on the Google Ads search network has actually decreased compared to previous years. In contrast, Display CPA has seen a slight increase, highlighting the differences between ad types and their respective performance across channels.
On average, the CPA in Google Ads across all industries is $48.96 for search and $75.51 for display.
These figures are essential to understand, as CPA directly impacts the overall return on investment (ROI) from your campaigns. If your CPA is higher than the industry average, it could signal that there’s room for optimization – whether in targeting, ad creatives, or landing pages.
Average Conversion Rates in Google Ads
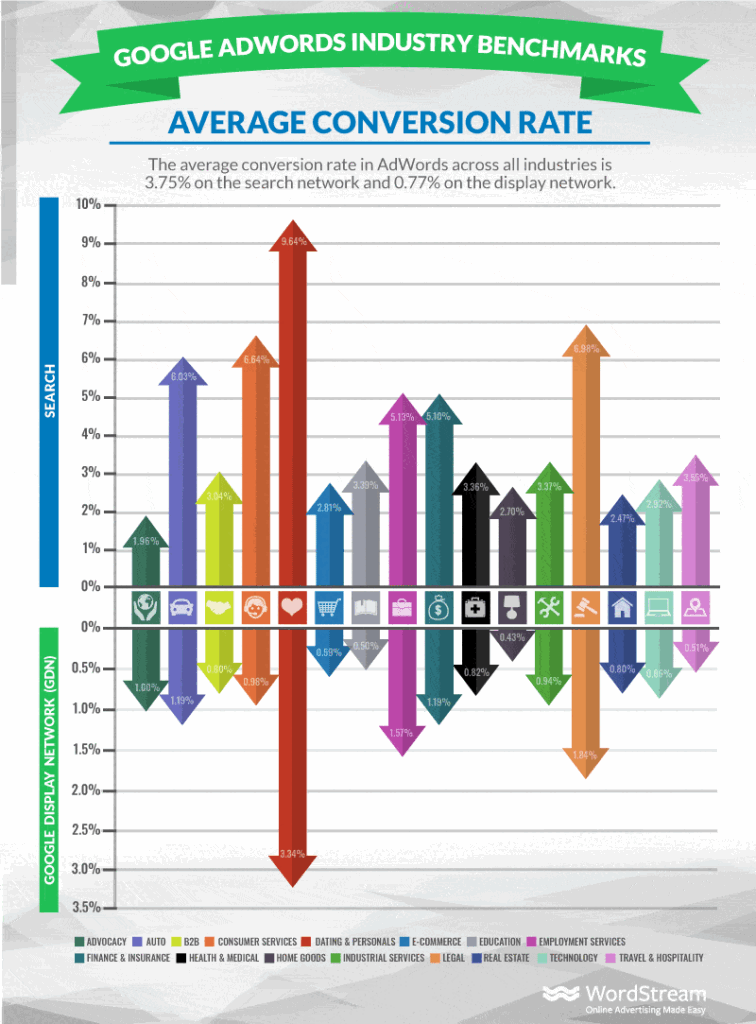
The average conversion rate in Google Ads varies between the search network and the display network:
- The average conversion rate for search campaigns is 6.96%.
- The average conversion rate for display campaigns is 0.77%.
Conversion rates fluctuate significantly across industries. Some of the industries with the highest conversion rates include:
- Dating & Personals
- Legal
- Automotive
- Consumer Services
On the other hand, industries like Real Estate and Home Goods tend to see lower conversion rates. These sectors are highly competitive, and the decision-making process for consumers often involves more research and time. Consumers in these markets typically want to carefully evaluate options before making a purchase or commitment, which contributes to the lower conversion rates.
Takeaways:
If your conversion rates are below the average for your industry, it might be time to optimize your Google Ads campaigns. Focus on improving your ad targeting, refining your landing page experience, and testing different strategies to boost conversions. The Google Ads industry benchmarks provide a useful reference point for setting realistic goals and adjusting your marketing efforts. Additionally, aligning your efforts with SEO ranking factors can help improve your organic search performance, complementing your paid campaigns and enhancing your overall marketing strategy.
Conclusion: Optimizing Your Google Ads Campaigns with Benchmarks
Understanding Google Ads industry benchmarks is crucial for running successful campaigns. By comparing your CPC, CTR, conversion rates, and CPA to industry standards, you can assess how well your ads are performing and identify areas for improvement. Whether you’re working in competitive industries like legal services or looking to optimize your conversion rates in the retail sector, these benchmarks provide the context you need to refine your strategy.
If your metrics fall below the average, it’s a clear signal to revisit your ad targeting, landing page experience, and overall strategy. Google AdWords services can provide expert guidance on how to manage and optimize your campaigns more effectively, ensuring that your Google Ads efforts are aligned with the latest industry standards.
Use these insights to set more realistic budgets, align your expectations, and take actionable steps toward optimizing your Google Ads campaigns. With continuous monitoring and optimization, you’ll stay ahead in the ever-evolving digital marketing landscape.