

In the fast-moving world of digital marketing, understanding how your Google Ads campaigns perform compared to industry standards is critical. Google Ads industry benchmarks include:
- Average click-through rate (CTR)
- Average cost per click (CPC)
- Average conversion rate (CVR)
- Average cost per action (CPA)
- Cost Per Lead (CPL)
These benchmarks give marketers a clear picture of what “normal” performance looks like, helping businesses identify underperforming campaigns, set realistic goals, and allocate budget more effectively. Whether you’re optimizing a campaign or planning new ads, knowing where you stand against the competition can be the difference between wasted spend and measurable ROI.
Table of Contents
- Search Ads Benchmarks Trends for Your Business
- Why Are Search Ads Benchmarks and Trends Important for Your Business
- Search Ads Benchmarks for Every Industry
- Average Click-Through Rate in Search Ads
- Average Cost Per Click In Search Ads
- Average Conversion Rates in Google Ads by Industry
- Average Cost Per Lead in Google Ads by Industry
- Final Thought
Search Ads Benchmarks Trends for Your Business and Why It’s Important.
Search advertising continues to evolve rapidly, and 2025 is shaping up to be a pivotal year. Here’s what your business needs to know about the latest Google Search Ads performance benchmarks and trends:
Average Performance Benchmarks (Q1 2025)
Based on aggregated industry data across various sectors:
- Average CTR (Click-Through Rate): 5.7 CTRs have slightly improved due to better ad targeting and AI-driven optimization tools.
- Average CPC (Cost-Per-Click): $2.18 CPCs remain stable overall but vary significantly by industry (e.g., legal and finance still face higher averages >$6.00).
- Average Conversion Rate: 7.3% Improved landing page experiences and use of Performance Max have contributed to this increase.
- Average CPA (Cost-Per-Acquisition): $33.40 CPAs have increased marginally due to rising competition, but automation helps keep them efficient.
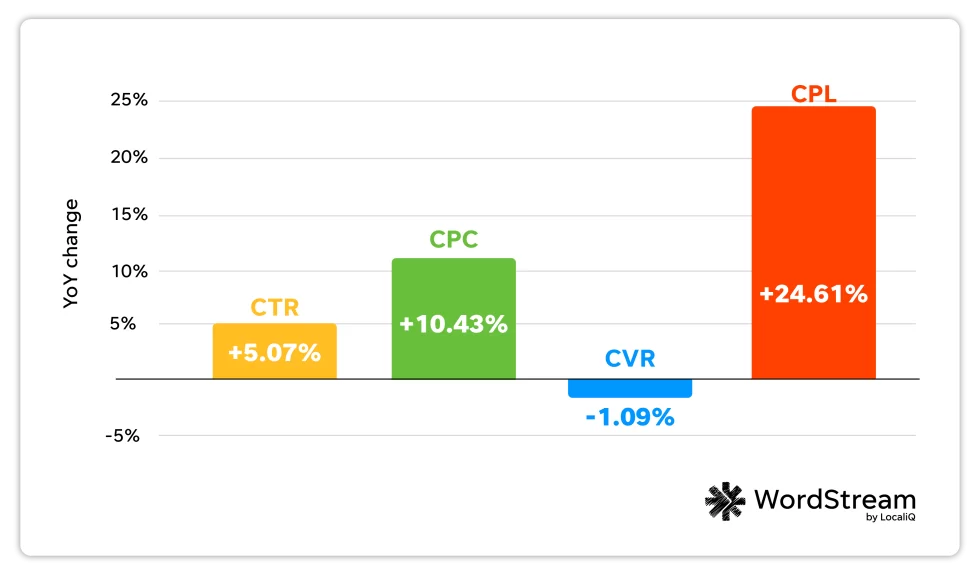
Source: Wordstream
Search ads benchmarks and trends help you measure performance, optimize campaigns, and stay competitive in the digital landscape. By tracking Google Ads industry benchmarks, you can identify gaps, improve targeting, and avoid costly Google Ads mistakes
PPC Basics
Pay-Per-Click (PPC) advertising is a digital marketing model where advertisers pay each time a user clicks on their ad. Google Ads is the most widely used PPC platform, allowing businesses to appear in search results and across the web. Key performance metrics like CTR, CPC, CVR, and CPA help advertisers measure and optimize their campaigns for cost-efficiency and ROI.

Source: WordStream
PPC ads come in different shapes and sizes (literally), and can be made up of text, images, videos, or a combination. They can appear on search engines, websites, social media platforms, and more.
Average Click-Through Rate in Google Ads by Industry
Click-through rate (CTR), though sometimes overshadowed by cost-focused metrics, is a crucial indicator of your search campaign’s performance. It reflects how often people click on your ad after it appears in the search engine results page (SERP), representing a significant step toward achieving conversions.

Source:wordstream
The average click-through rate in Google Ads across all industries is 3.17% for search and 0.46% for display.
Average Click Through Rate (CTR)

Average click-through rate: YoY
Here’s how click-through rates have changed in 2024:

Source: wordstream
The industries that experienced the most significant increases in CTR performance year over year were Finance and Insurance (up 24.75%), Shopping, Collectibles, and Gifts (up 22.22%), and Home and Home Improvement (up 16.46%).
Conversely, the industries with the largest decreases in CTR year over year were Animals and Pets (down 8.99%), Sports and Recreation (down 8.26%), and Apparel, Fashion, and Jewelry (down 5.11%).
The average CTR in 2024 is 6.42%, which is higher than last year’s average of 6.11%.
Average Cost Per Click in Google Ads by Industry
The average cost per click (CPC) in Google or Microsoft Ads is determined by dividing the total expenditure of a campaign by its total number of clicks. Clicks are crucial in search campaigns, bringing potential customers from an ad to a landing page.

Source: WordStream
The average cost per click in Google Ads across all industries is $2.69 for search and $0.63 for display.
Average Cost Per Click (CPC)
Your average click-through rate serves as a significant indicator of the effectiveness of your search ad quality. When you have a higher ad rank coupled with compelling ad copy, you are more likely to attract a greater number of clicks, which in turn, plays a pivotal role in driving conversions.
To calculate your average click-through rate, you divide the total number of clicks by the total number of impressions.


Average Conversion Rates in Google Ads by Industry
The average conversion rate is a crucial metric in assessing the effectiveness of your campaigns. It is calculated by dividing the total number of conversions by the total number of clicks.
A higher conversion rate can offset costs per lead, directly impacting your company’s profitability. As Colarossi points out, the conversion rate is perhaps the most vital metric to measure the success of PPC campaigns. It provides essential insights into how effectively a campaign is converting leads into customers, which is the primary goal for most of these campaigns.
A high conversion rate indicates that a campaign is successfully engaging its target audience and compelling them to take the desired action. Given its significance, investing in a Conversion Rate Optimization (CRO) service becomes crucial for enhancing these rates and, subsequently, the success of your PPC campaigns.

Source: WordStream
Average Conversion Rate (CVR)
The average conversion rate is a crucial metric in assessing the effectiveness of your campaigns. It is calculated by dividing the total number of conversions by the total number of clicks.
A higher conversion rate can offset costs per lead, directly impacting your company’s profitability. As Colarossi points out, the conversion rate is perhaps the most vital metric to measure the success of PPC campaigns. It provides essential insights into how effectively a campaign is converting leads into customers, which is the primary goal for most of these campaigns.
A high conversion rate indicates that a campaign is successfully engaging its target audience and compelling them to take the desired action.

Average Cost Per Lead in Google Ads by Industry
Average Cost Per Action (CPA) is a digital advertising metric that measures the amount an advertiser pays for a specific action—such as a sale, sign-up, or lead, resulting from an ad. It’s a key performance indicator used to assess the efficiency and ROI of paid campaigns.

Source: wordstream
The average CPA in Google Ads across all industries is $48.96 for search and $75.51 for display.
Average Cost Per Action (CPA)

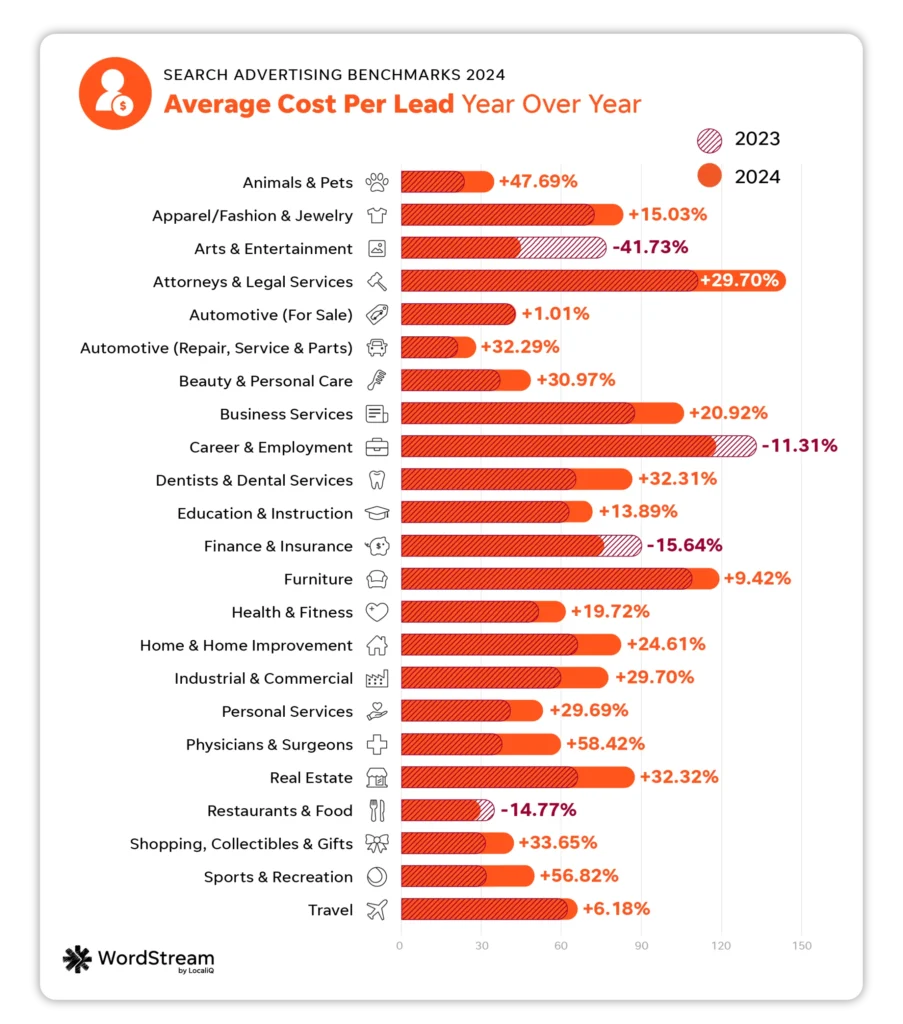
Cost Per Lead On Average: YoY
As most industries have seen increases in average cost per lead this year, let’s examine how this trend compares to the previous year:
Source: wordstream
The industries that experienced the most significant reductions in cost per lead (CPL) were Arts and Entertainment with a decrease of 41.73%, Finance and Insurance with a 15.64% decrease, and Restaurants and Food with a 14.77% decrease.
Conversely, the industries that saw an increase in CPL year over year were Physicians and Surgeons with a rise of 58.42%, Sports and Recreation with a 56.82% increase, and Animals and Pets with a 47.69% increase.
This year’s overall CPL stands at $66.69, which is $13.17 higher than last year’s average of $53.52.
Tracking and Reporting Are Crucial
This report highlights the importance of effective Google Ads reporting and tracking for business success. Keeping up with Google Ads industry benchmarks and comparing your performance against competitors is key.
Brett McHale, a Paid Media Marketing Expert and Founder of Empiric Marketings emphasizes the need to focus on performance metrics that are most relevant to your business. He explains that even with a high cost per click, you can achieve an optimal lead cost if your conversion rate is high. This demonstrates the value of optimizing for metrics that align with your business strategy.
He also advises concentrating on structuring your account and campaigns to meet your PPC advertising goals. Prioritizing metrics that support these goals can significantly improve PPC (Pay-Per-Click) results.

Source: WordStream
Jackson says that reports like this one, along with looking at your own ad account and goals, can help you make smart marketing choices based on data. She notes that it’s important to keep an eye on things like how much you pay for each click and how many people click on your ads. However, these shouldn’t be the only things you focus on, because good numbers in these areas don’t always mean your ads are giving you the profit you want. But, they are useful for making your ads better.
Smith agrees and adds that in digital ads, knowing how much each click costs, how often people click your ads, how many of those clicks turn into customers, and how much you pay for each customer are all important. By keeping track of these things, you can figure out which ads work best and change your plan to make your ads do even better. This way, you can get more out of your ads and meet your business goals more effectively.
Google Ads Benchmarks vs. Meta (Facebook) Ads: A Quick Comparison
When planning cross-platform ad campaigns, it’s essential to understand how performance benchmarks compare between Google Ads and Meta (Facebook) Ads. While both platforms are powerful, they serve slightly different purposes and audiences.
- Click-Through Rate (CTR): Google Ads often see higher CTRs, especially for search intent-based queries, as users are actively looking for solutions. Meta Ads generally see lower CTRs but offer high visibility in discovery and interest-driven campaigns.
- Cost-Per-Click (CPC): Meta Ads usually have a lower CPC compared to Google Ads, making them attractive for top-of-funnel awareness campaigns. However, the conversion intent may be lower on Meta compared to high-intent search queries on Google.
- Conversion Rates: Google Ads typically deliver better conversion rates for users with strong purchase intent. Meta may require more nurturing but performs well with visually appealing offers and strong creative.
- Audience Targeting: Meta excels in demographic and interest-based targeting, while Google leverages keyword-based intent and behavior data across the web.
For businesses running campaigns on both platforms, understanding these differences helps with budget allocation, strategy design, and performance expectations. It also positions you to better interpret benchmarks based on the platform’s strengths.
Final Thought
So, which industry converts the best online? The answer is dating and personals! That’s how popular online dating has gotten. After dating and personals, we have legal, which should be comforting for people who are spending all that money on the cost-per-click.
Don’t let these statistics demotivate you. They are here so that we can have guidelines on whether the strategy is working or if we need to do some optimization. We have seen CTRs skyrocket with our clients, while effectively decreasing their cost-per-click. With an effective strategy and an experienced eye to audit your campaigns, it’s possible!
Considering regional trends and performance metrics is essential for those specifically focused on digital marketing in Canada, as they can differ significantly from global benchmarks.
If you’re not sure where to start, or if you’ve been managing your PPC campaigns but aren’t seeing the results you want, PPC management services can help. Services can range from optimizing your existing campaign to complete management of your PPC account.
If you are targeting a global audience, conducting a digital marketing audit for global markets is essential to identify opportunities and optimize your strategies accordingly. Where do you stand in regard to your industry benchmarks? We would love to chat and discuss Google Ads industry benchmarks!
FAQs
This could indicate that while fewer people are clicking your ads, those who do are highly qualified. In this case, improving ad copy to attract more of your ideal audience could increase CTR without sacrificing quality leads.
Quality Score also considers:Ad relevance (does your ad copy match keywords?)
Keyword grouping (tightly themed ad groups),Historical performance (Google rewards consistent accounts),,Regularly optimize these to lift your scores and reduce CPC.
Compare your performance to the average for your industry. If you’re below average, identify which metrics need work—like ad copy, bidding strategy, or targeting—and refine them.
No. The total number of conversions will be lower than the total number of clicks, but the conversion RATE can be higher. For example, if only 1 out of 100 people click your ad, but every single person who clicks your ad converts, that’s a 1% click-through rate but a 100% conversion rate. The conversion rate is based on people who click, not the total # of people who saw the ad from the beginning.