

Knowing Google Ads industry benchmarks is crucial for businesses using the platform to promote their products or services. These benchmarks provide a valuable reference point, helping companies assess the effectiveness of their advertising strategies and compare their performance against industry standards. By understanding these metrics, businesses can optimize their campaigns, ensuring they are competitive and efficient.
Wordstream has compiled and updated Google Ads industry benchmarks using data from U.S. businesses across twenty industries, including Advocacy, Auto, B2B, Consumer Services, Dating and Personals, E-Commerce, Education, Employment Services, Finance and Insurance, Health and Medical, Home Goods, Industrial Services, Legal, Real Estate, Technology, and Travel & Hospitality. Ignoring these benchmarks can lead to missed opportunities and underperformance, as businesses may not fully leverage their advertising potential or allocate their budgets effectively.
Table of Contents
- Search Ads Benchmarks Trends for Your Business
- Why Are Search Ads Benchmarks and Trends Important for Your Business
- Search Ads Benchmarks for Every Industry
- Average Click-Through Rate in Search Ads
- Average Cost Per Click In Search Ads
- Average Conversion Rates in Google Ads by Industry
- Average Cost Per Lead in Google Ads by Industry
- Final Thought
Search Ads Benchmarks Trends for Your Business
Search ads benchmarks are crucial for businesses to gauge their performance in digital advertising. These benchmarks provide insights into key metrics such as click-through rates (CTR), cost-per-click (CPC), and conversion rates across various industries. Understanding these trends helps businesses set realistic goals, optimize their ad spend, and improve their overall advertising strategy. By comparing their performance against industry standards, companies can identify areas for improvement and capitalize on market opportunities. Staying updated with the latest benchmarks is essential for maintaining a competitive edge and maximizing return on investment (ROI) in search advertising.
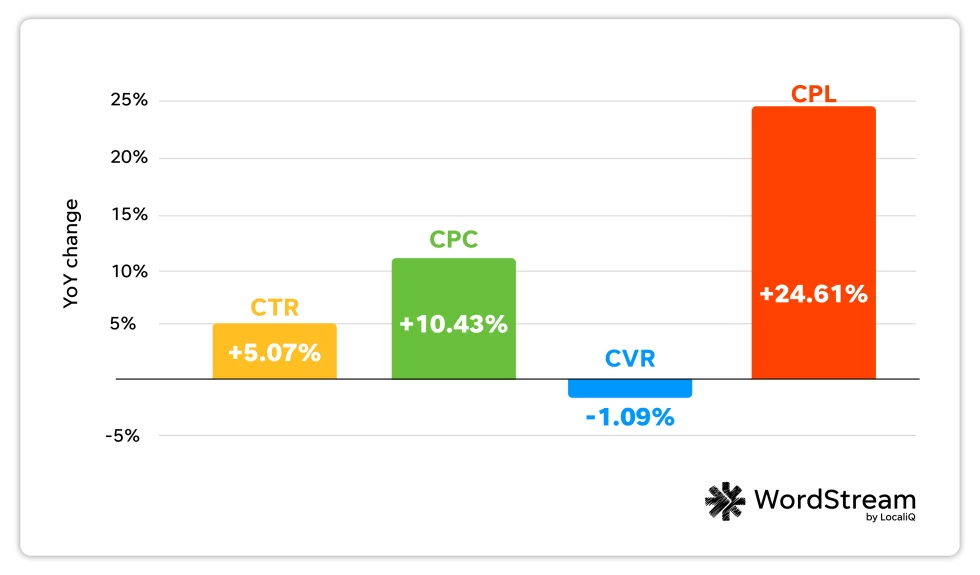
- Click-Through Rate (CTR): 70% of industries experienced an increase in click-through rates (CTR) year over year, with some showing significant gains. The overall average increase was 5% compared to 2023.
- Cost Per Click (CPC): Cost per click (CPC) rose for 86% of industries, with some, such as Real Estate, Sports & Recreation, and Personal Services, experiencing increases of over 25% year over year. The average overall CPC increase was 10%.
Source: wordstream
- Conversion Rate (CVR): Conversion rates decreased in 12 out of 23 industries, though the average decline was relatively small at only 1%. Some industries experienced more significant drops, such as Finance & Insurance (-32.40%) and Dentists & Dental Services (-19.57%). Conversely, some industries saw substantial year-over-year increases in conversion rates, including Apparel / Fashion & Jewelry (112.01%) and Career & Employment (80.97%).
- Cost Per Lead (CPL): Cost per lead (CPL) increased in 19 out of 23 industries, with an average rise of about 25%. This is slightly lower than the 27% increase observed last year, which followed a period of record inflation and economic instability.
Why Are Search Ads Benchmarks and Trends Important for Your Business
Search ad benchmarks and Trends play a pivotal role in the success of your business’s digital advertising efforts for several reasons, and understanding Google Ads industry benchmarks is a key part of this process.
Furthermore, being aware of common Google Ads mistakes that will ruin your account is essential to avoid pitfalls and maximize the effectiveness of your campaigns.
Here’s why they are crucial for your business:
The Way Customers Search Is Evolving Quickly
The declining average conversion rate in 91% of industries suggests a shift in the buyer’s journey, with consumers becoming more cautious due to economic factors like inflation. This caution leads to more deliberate purchasing decisions, contributing to lower conversion rates despite higher click-through rates. According to Irvine, search advertisers must recognize the broader context of their prospects’ searches, as the cost implications now extend beyond the initial ad impression.
Source: Wordstream.com
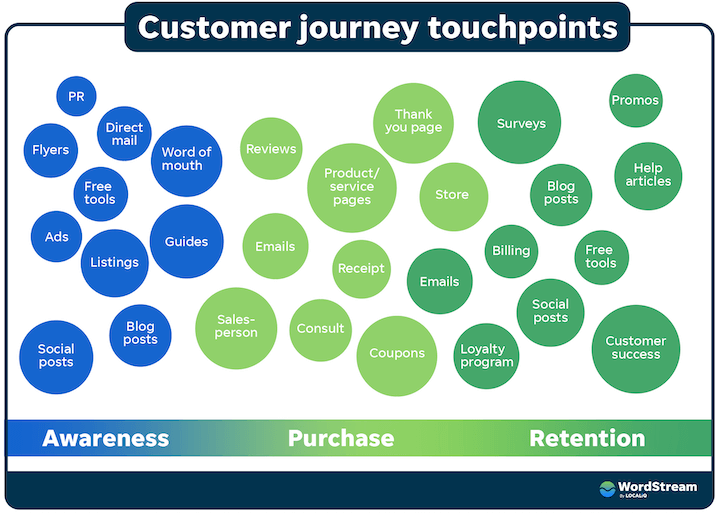
Furthermore, the diverse digital landscape allows potential customers to engage with businesses across various channels before making a purchase. This indicates that while search advertising may capture early-stage interest, other marketing strategies are needed to guide these prospects toward conversion.
Additionally, the use of Google Ads for small businesses is becoming increasingly important in this diverse digital landscape, offering targeted and cost-effective solutions for engaging with potential customers across different stages of their buying journey. Understanding Google ads industry benchmarks can help businesses optimize their strategies effectively.
Data-Driven Decision-Making
Search Ads Benchmarks and Trends provide you with a wealth of data and statistics specific to your industry and competitors. By analyzing this information, you can make informed decisions about your advertising strategy. For instance, understanding that your industry’s average Click-Through Rate (CTR) is 3.17% allows you to set realistic performance goals and gauge the effectiveness of your campaigns.
Tracking and Reporting Are Crucial
This report highlights the importance of effective Google Ads reporting and tracking for business success. Keeping up with Google Ads industry benchmarks and comparing your performance against competitors is key.
Brett McHale, a Paid Media Marketing Expert and Founder of Empiric Marketings emphasizes the need to focus on performance metrics that are most relevant to your business. He explains that even with a high cost per click, you can achieve an optimal lead cost if your conversion rate is high. This demonstrates the value of optimizing for metrics that align with your business strategy.
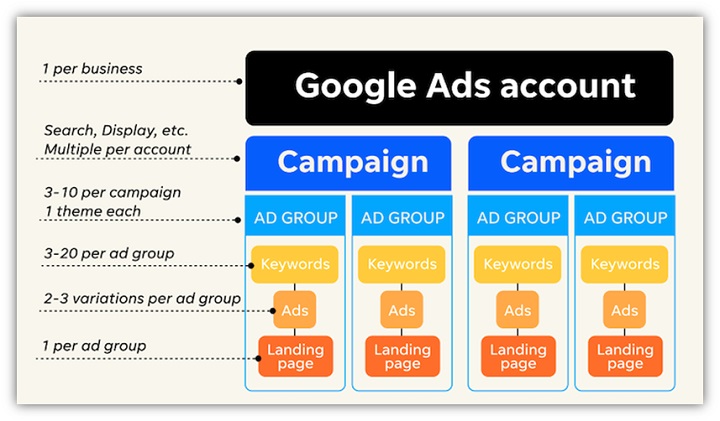
He also advises concentrating on structuring your account and campaigns to meet your PPC advertising goals. Prioritizing metrics that support these goals can significantly improve PPC (Pay-Per-Click) results.
Jackson says that reports like this one, along with looking at your own ad account and goals, can help you make smart marketing choices based on data. She notes that it’s important to keep an eye on things like how much you pay for each click and how many people click on your ads. However, these shouldn’t be the only things you focus on, because good numbers in these areas don’t always mean your ads are giving you the profit you want. But, they are useful for making your ads better.
Smith agrees and adds that in digital ads, knowing how much each click costs, how often people click your ads, how many of those clicks turn into customers, and how much you pay for each customer are all important. By keeping track of these things, you can figure out which ads work best and change your plan to make your ads do even better. This way, you can get more out of your ads and meet your business goals more effectively.
Recent Updates To Search Campaigns Have Made Ads More Clickable
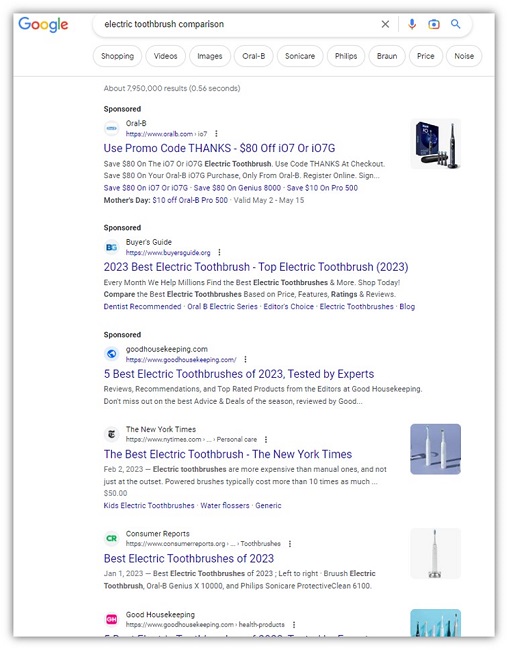
The rise in click-through rates across nearly all industries indicates a growing tendency for people to engage with ads. This increase can be attributed to platform enhancements such as making responsive search ads the default, the introduction of additional ad assets, and ads blending more seamlessly with organic results on Google’s interface. To remain competitive, advertisers need to focus on optimizing ad copy and utilizing various ad assets.
Saskin Gales also credits new ad formats for the spike in CTR, suggesting that advertisers are effectively using automated solutions like Performance Max and dynamic search ads to present more engaging and relevant content to their audiences.
Budget Allocation
As average costs per lead and click rise across most industries, efficiently managing a limited Google Ads budget becomes increasingly challenging. Advertisers need to invest wisely to keep up with these escalating costs. Flexible budgeting is key to success in cost-per-click and lead metrics. By being prepared to adjust the budget according to specific needs and market trends, advertisers can maximize the effectiveness of their campaigns.
Stephanie Scanlan, Vice President of Client Success at LocaliQ, emphasizes the necessity of proper budgeting for campaign success. She highlights the importance of having an adequate budget to compete effectively in ad auctions, emphasizing that without it, other aspects like website quality, keyword optimization, and ad text become secondary.
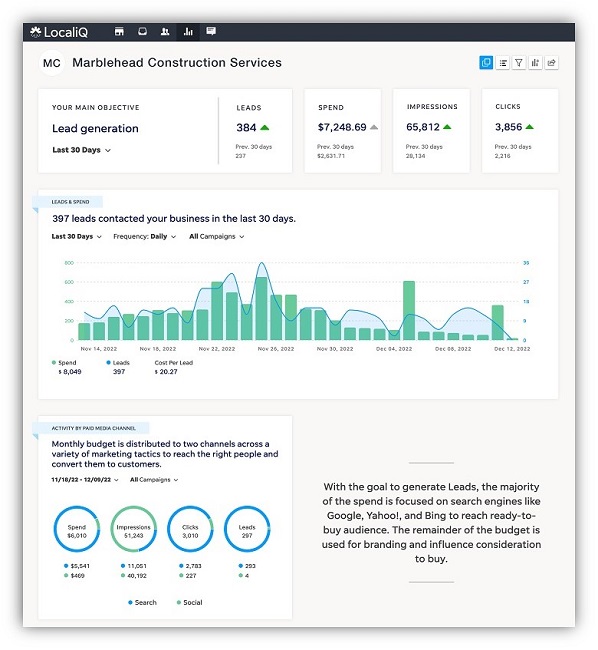
To maintain a dynamic budget strategy, it’s advisable to use spend-tracking tools like the Google Ads budget report or the LocaliQ Marketing Dashboard, which assist in monitoring budget allocation across different campaigns.
Search Ads Benchmarks for Every Industry
Here are the combined industry benchmarks for Microsoft Ads and Google Ads for all four KPIs to begin our data exploration.

Source: wordstream
After examining the combined industry benchmarks for Microsoft Ads and Google Ads across all four KPIs, it’s important to note the recent new features of Microsoft Ads, which offer enhanced targeting and analytics capabilities to further optimize advertising strategies.
Average Click-Through Rate in Search Ads
Click-through rate (CTR), though sometimes overshadowed by cost-focused metrics, is a crucial indicator of your search campaign’s performance. It reflects how often people click on your ad after it appears in the search engine results page (SERP), representing a significant step toward achieving conversions.
The average click-through rate in Google Ads in 2024 is 6.42%.

Source:wordstream
The industries with the highest average click-through rates (CTRs) this year were Arts and Entertainment at 13.04%, Sports and Recreation at 9.66%, and Real Estate at 9.20%.
| Business Category | Avg. CTR |
|---|---|
| Animals & Pets | 7.39% |
| Apparel / Fashion & Jewelry | 6.13% |
| Arts & Entertainment | 13.04% |
| Attorneys & Legal Services | 5.30% |
| Automotive — For Sale | 8.58% |
| Automotive — Repair, Service & Parts | 5.69% |
| Beauty & Personal Care | 6.75% |
| Business Services | 5.62% |
| Career & Employment | 6.79% |
| Dentists & Dental Services | 5.38% |
| Education & Instruction | 6.21% |
| Finance & Insurance | 7.71% |
| Furniture | 6.50% |
| Health & Fitness | 6.88% |
| Home & Home Improvement | 5.59% |
| Industrial & Commercial | 5.83% |
| Personal Services | 7.95% |
| Physicians & Surgeons | 6.73% |
| Real Estate | 9.20% |
| Restaurants & Food | 8.08% |
| Shopping, Collectibles & Gifts | 7.81% |
| Sports & Recreation | 9.66% |
| Travel | 10.16% |
In contrast, the industries with the lowest average CTRs were Attorneys and Legal Services at 5.30%, Home and Home Improvement at 5.59%, and Dentists and Dental Services at 5.38%.
The overall rise in CTR across most industries suggests a more ad-friendly search engine results page (SERP). This can have both positive and negative effects: while ads blending more seamlessly with organic results can lead to increased clicks for advertisers, it may also result in reduced organic traffic.
Average click-through rate: YoY
Here’s how click-through rates have changed in 2024:

Source: wordstream
The industries that experienced the most significant increases in CTR performance year over year were Finance and Insurance (up 24.75%), Shopping, Collectibles, and Gifts (up 22.22%), and Home and Home Improvement (up 16.46%).
Conversely, the industries with the largest decreases in CTR year over year were Animals and Pets (down 8.99%), Sports and Recreation (down 8.26%), and Apparel, Fashion, and Jewelry (down 5.11%).
The average CTR in 2024 is 6.42%, which is higher than last year’s average of 6.11%.
Average Cost Per Click In Search Ads
The average cost per click (CPC) in Google or Microsoft Ads is determined by dividing the total expenditure of a campaign by its total number of clicks. Clicks are crucial in search campaigns, bringing potential customers from an ad to a landing page.
The average cost per click in Google Ads in 2024 is $4.66.

Source: wordstream
Accounts with higher click-through rates (CTR) often enjoy lower CPCs, as increased clicks compensate for the total spend. However, this isn’t always consistent due to factors like intense industry competition.
| Business Category | Avg. CPC |
|---|---|
| Animals & Pets | $3.90 |
| Apparel / Fashion & Jewelry | $3.39 |
| Arts & Entertainment | $1.72 |
| Attorneys & Legal Services | $8.94 |
| Automotive — For Sale | $2.34 |
| Automotive — Repair, Service & Parts | $3.39 |
| Beauty & Personal Care | $3.56 |
| Business Services | $5.37 |
| Career & Employment | $4.53 |
| Dentists & Dental Services | $6.82 |
| Education & Instruction | $4.39 |
| Finance & Insurance | $3.00 |
| Furniture | $3.29 |
| Health & Fitness | $4.71 |
| Home & Home Improvement | $6.96 |
| Industrial & Commercial | $4.95 |
| Personal Services | $4.95 |
| Physicians & Surgeons | $4.76 |
| Real Estate | $2.10 |
| Restaurants & Food | $2.18 |
| Shopping, Collectibles & Gifts | $2.61 |
| Sports & Recreation | $2.34 |
| Travel | $1.92 |
Average Cost Per Click: YoY
Let’s see how the above cost-per-click numbers compare to last year’s data:

Source: wordstream
The industries that experienced the largest increases in cost per click (CPC) were Real Estate (up by 35.48%), Sports and Recreation (up by 32.20%), and Personal Services (up by 26.92%).
On the other hand, the industries with the most significant improvements in CPC performance were Finance and Insurance (decreased by 25.19%), Attorneys and Legal Services (decreased by 2.93%), and Business Services (decreased by 1.83%).
This year, the overall average CPC is $4.66, which is 44 cents higher than last year’s average of $4.22.
Average Conversion Rates in Google Ads by Industry
The average conversion rate is a crucial metric in assessing the effectiveness of your campaigns. It is calculated by dividing the total number of conversions by the total number of clicks.
A higher conversion rate can offset costs per lead, directly impacting your company’s profitability. As Colarossi points out, the conversion rate is perhaps the most vital metric to measure the success of PPC campaigns. It provides essential insights into how effectively a campaign is converting leads into customers, which is the primary goal for most of these campaigns.
A high conversion rate indicates that a campaign is successfully engaging its target audience and compelling them to take the desired action. Given its significance, investing in a Conversion Rate Optimization (CRO) service becomes crucial for enhancing these rates and, subsequently, the success of your PPC campaigns.
The average conversion rate in Google Ads in 2024 is 6.96%.

Source: wordstream
Industries with the highest average conversion rates (CVRs) included Automotive Repair, Service, and Parts at 12.96%, Animals and Pets at 12.03%, and Physicians and Surgeons at 11.08%. On the other hand, industries with the lowest average CVRs were Furniture at 2.53%, Finance and Insurance at 2.78%, and Real Estate at 2.91%.
| Business Category | Avg. CVR |
|---|---|
| Animals & Pets | 12.03% |
| Apparel / Fashion & Jewelry | 3.33% |
| Arts & Entertainment | 4.22% |
| Attorneys & Legal Services | 5.64% |
| Automotive — For Sale | 6.49% |
| Automotive — Repair, Service & Parts | 12.96% |
| Beauty & Personal Care | 8.01% |
| Business Services | 5.78% |
| Career & Employment | 5.63% |
| Dentists & Dental Services | 8.36% |
| Education & Instruction | 7.91% |
| Finance & Insurance | 2.78% |
| Furniture | 2.53% |
| Health & Fitness | 7.40% |
| Home & Home Improvement | 8.62% |
| Industrial & Commercial | 6.84% |
| Personal Services | 8.83% |
| Physicians & Surgeons | 11.08% |
| Real Estate | 2.91% |
| Restaurants & Food | 8.72% |
| Shopping, Collectibles & Gifts | 3.49% |
| Sports & Recreation | 5.35% |
| Travel | 5.36% |
As advertisements increasingly resemble organic results and occupy more space on search engine results pages (SERPs), even for terms with low commercial intent, lower CVRs may become more common. This trend is likely due to an increase in clicks from users who are not yet ready to convert.
Average conversion rate: YoY
Now, take a look at conversion rates year over year:

Source: wordstream
The industries that saw the most significant decreases in conversion rates were Finance and Insurance (down by 32.40%), Dentists and Dental Services (down by 19.57%), and Attorneys and Legal Services (down by 19.46%).
On the other hand, the industries with the largest increases in conversion rates were Apparel, Fashion, and Jewelry (up by 112%), Career and Employment (up by 80.97%), and Restaurants and Food (up by 72.16%).
The overall average conversion rate for 2024 is 6.96%, which is just slightly lower than last year’s average of 7.04%.
Average Cost Per Lead in Google Ads by Industry
For many advertisers, the cost per lead is considered the crucial ‘money metric.’ This metric is calculated by dividing the total amount spent on a campaign by the total number of conversions it yields. Essentially, it measures the efficiency of your PPC advertising expenditure in terms of the ‘bang for your buck.’
The average cost per lead in Google Ads in 2024 is $66.69.

Source: wordstream
The industries with the lowest average cost per lead (CPL) were Automotive Repair, Service, and Parts at $27.94, followed by Restaurants and Food at $29.67, and Animals and Pets at $34.81.
| Business Category | Avg. CPL |
|---|---|
| Animals & Pets | $34.81 |
| Apparel / Fashion & Jewelry | $83.10 |
| Arts & Entertainment | $44.70 |
| Attorneys & Legal Services | $144.03 |
| Automotive — For Sale | $42.95 |
| Automotive — Repair, Service & Parts | $27.94 |
| Beauty & Personal Care | $48.42 |
| Business Services | $105.64 |
| Career & Employment | $117.92 |
| Dentists & Dental Services | $86.49 |
| Education & Instruction | $71.52 |
| Finance & Insurance | $75.94 |
| Furniture | $119.10 |
| Health & Fitness | $61.56 |
| Home & Home Improvement | $82.27 |
| Industrial & Commercial | $77.48 |
| Personal Services | $52.98 |
| Physicians & Surgeons | $59.74 |
| Real Estate | $87.36 |
| Restaurants & Food | $29.67 |
| Shopping, Collectibles & Gifts | $42.10 |
| Sports & Recreation | $49.90 |
| Travel | $66.02 |
Source: wordstream
On the other hand, the industries with the highest average CPLs were Attorneys and Legal Services at $144.03, Furniture at $119.10, and Career and Employment at $117.92.
Cost Per Lead On Average: YoY
As most industries have seen increases in average cost per lead this year, let’s examine how this trend compares to the previous year:

Source: wordstream
The industries that experienced the most significant reductions in cost per lead (CPL) were Arts and Entertainment with a decrease of 41.73%, Finance and Insurance with a 15.64% decrease, and Restaurants and Food with a 14.77% decrease.
Conversely, the industries that saw an increase in CPL year over year were Physicians and Surgeons with a rise of 58.42%, Sports and Recreation with a 56.82% increase, and Animals and Pets with a 47.69% increase.
This year’s overall CPL stands at $66.69, which is $13.17 higher than last year’s average of $53.52.
Final Thought
So, which industry converts the best online? The answer is dating and personals! That’s how popular online dating has gotten. After dating and personals, we have legal, which should be comforting for people who are spending all that money on the cost-per-click.
Don’t let these statistics demotivate you. They are here so that we can have guidelines on whether the strategy is working or if we need to do some optimization. We have seen CTRs skyrocket with our clients, while effectively decreasing their cost-per-click. With an effective strategy and an experienced eye to audit your campaigns, it’s possible!
Considering regional trends and performance metrics is essential for those specifically focused on digital marketing in Canada, as they can differ significantly from global benchmarks.
If you’re not sure where to start, or if you’ve been managing your PPC campaigns but aren’t seeing the results you want, PPC management services can help. Services can range from optimizing your existing campaign to complete management of your PPC account.
If you are targeting a global audience, conducting a digital marketing audit for global markets is essential to identify opportunities and optimize your strategies accordingly. Where do you stand in regard to your industry benchmarks? We would love to chat and discuss Google Ads industry benchmarks!